An Interactive Node-Link Visualization of Convolutional Neural Networks
Featured in Popular Science

Abstract
Convolutional neural networks are at the core of state-of-the-art approaches to a variety of computer vision tasks. Visualizations of neural networks typically take the form of static node-link diagrams, which illustrate only the structure of a network, rather than the behavior. Motivated by this observation, this paper presents a new interactive visualization of neural networks trained on handwritten digit recognition, with the intent of showing the actual behavior of the network given user-provided input. The user can interact with the network through a drawing pad, and watch the activation patterns of the network respond in real time.
Demo
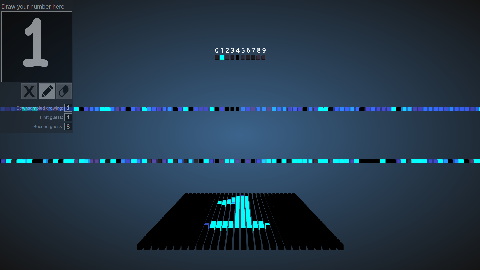 |
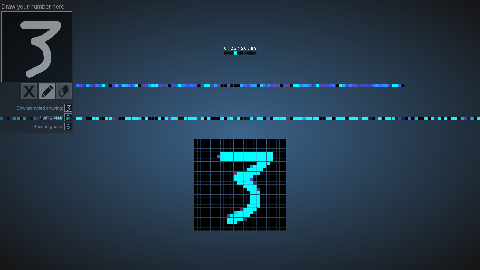
This network has 784 nodes on the bottom layer (corresponding to pixels), 300 nodes in the first hidden layer, 100 nodes in the second hidden layer, and 10 nodes in the output layer (corresponding to the 10 digits). |
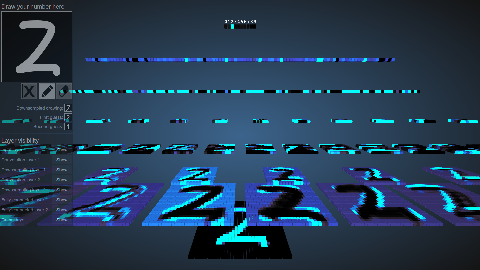 |
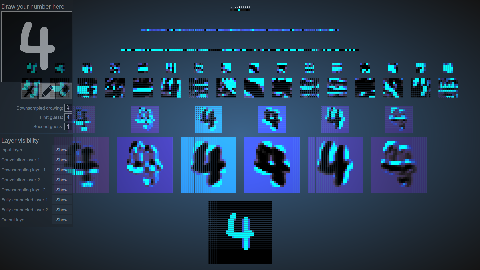
This network has 1024 nodes on the bottom layer (corresponding to pixels), six 5x5 (stride 1) convolutional filters in the first hidden layer, followed by sixteen 5x5 (stride 1) convolutional filters in the second hidden layer, then three fully-connected layers, with 120 nodes in the first, 100 nodes in the second, and 10 nodes in the third. The convolutional layers are each followed by downsampling layer that does 2x2 max pooling (with stride 2). |
 |
This is the same as the first visualization, but with the nodes flattened on a plane so that they are easier to see all at once. |
 |
This is the same as the second visualization, but with the nodes flattened on a plane so that they are easier to see all at once. |
Code and implementation details
Our source code is freely available on github here.
A few details that might be interesting:
- The neural networks were implemented and trained using a custom MATLAB implementation of neural networks and backpropagation, which I wrote to help myself learn the basics.
- The neural networks' training data was an augmented version of MNIST, so as a result, these networks do best when the input drawings are upright and centered.
- The math for the visualizations is written in Javascript.
- The visualization itself is written in WebGL.
Paper
Citation
Bibtex format:
	      @inproceedings{harley2015isvc,

	          title = {An Interactive Node-Link Visualization of Convolutional Neural Networks},

	          author = {Adam W Harley},

	          booktitle = {ISVC},

	          pages = {867--877},

	          year = {2015}

	      }